


/Digital%20montage%20(1).jpg?width=1920&name=Digital%20montage%20(1).jpg "Digital montage (1)")
by Jeff Hopkins, on 8/16/12 3:00 AM
Learn a little about flow curves, and you'll get the best performance
When we talk about matching a pressure regulator to the job, one of the primary tools is the flow curve. If you learn a bit about flow curves and how they work, you'll take care of business faster when you talk to your Swagelok technical specialist about your needs.
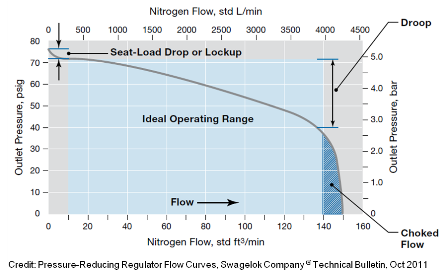
This typical flow curve for a pressure-reducing regulator illustrates several phenomena, including the ideal operating range, droop, choked flow, and seat-load drop or lockup. This graphic comes from the Pressure-Reducing Regulator Flow Curves bulletin, which is available for free download here:

It starts with a simple graph. The vertical axis shows the amount of pressure on the downstream side of the regulator. The horizontal axis shows the flow rate. When you plot the pressure that the regulator can maintain at various flow rates, you end up with the flow curve. You'll get a different curve for each set pressure.
Minimizing droop, choked flow, & lockup
In an ideal world, you'd want the curve to be a flat line: No change in pressure no matter what the flow rate. In the real world, that's not possible. Each regulator has its limits. Remember, it's a pressure regulator, not a flow regulator. Flow is controlled by a valve or flow meter. When the flow rate gets high enough, the curve on the right side of the graph will start to slope downward. That's called "droop."
If you operate a regulator in that zone, you'll get a relatively large pressure drop downstream. Go far enough to the right and you end up with "choked flow." That means the regulator is wide open and is no longer controlling pressure.
At the far left of the graph, you'll see a similar change as the line comes down sharply and flattens out. That's called "seat-load drop" or "lockup," another area where the regulator has a hard time maintaining pressure.
Flattening flow curves
What you want, then, is a regulator with a relatively flat flow curve in the range of pressures and flows where you intend to operate it. Each Swagelok pressure regulator has its own flow curve. Look at the conditions under which you plan to operate the regulator, and mark them right on the flow curve graph. If your numbers are far to the right or left where the line is no longer close to flat, look for a regulator model that is better suited for your specs.
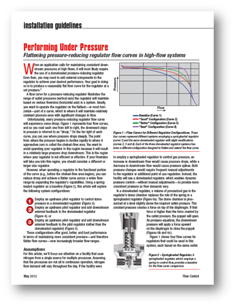 A May 2012 article by Michael Adkins of Swagelok Company tells why it's best for a pilot regulator to adjust based on the actual downstream system pressure.
Here's one more term to learn: Hysteresis. Basically, reading a flow curve left to right shows what happens as flow increases. When flow decreases, you would read the curve from right to left. But the curve doesn't follow exactly the same line when flow increases as it does when flow decreases. The difference between the two is called hysteresis. It's a good practice to use pressure gauges in the system to help fine-tune regulator settings.
As with many pieces of machinery, there are also a few things you can do to get better performance out of a pressure regulator. That is, you can flatten out the flow curve a bit.
- One way is to use an upstream pilot regulator for a domeloaded regulator. This controls pressure in the main regulator’s dome chamber, keeping it constant over a wider system flow range.
- An even better way is to use the pilot regulator plus external feedback from tubing run to the domeloaded regulator.
- For the flattest flow curve of all, add feedback tubing to the pilot regulator too. Your Swagelok representative can give you the details on all three methods.
There are a few other considerations when reading flow curves. For instance, make sure all the measurement units agree. Pressure readings are usually in psig or bar. Liquid flow is typically expressed as gallons per minute or liters per minute, while gas flow is expressed as cubic feet per minute or standard liters per minute.
Learn more
If you feel ready for a more advanced, technical explanation, we have two good resources for you:
- "Performing Under Pressure (Flow Curves)" by Michael Adkins, manager of Field Engineering and Pressure Regulators for Swagelok Company® (4 pages)
- "Technical Bulletin: Pressure-Reducing Regulator Flow Curves," from Swagelok Company (16 pages)
More articles like this:

")