
.webp?width=210&height=70&name=StickyLogo%20(5).webp "Swagelok Northern California home page")
Share this
by Jeff Hopkins on 1/15/13 7:00 AM
Enjoy this video on pressure reducing regulator flow curves, for more training, sign up for our next webinar on how to choose the right pressure reducing regulator for your application.

On January 17th, in a live technical webinar, customers of Swagelok Northern California will receive a 30 minute briefing from Swagelok field engineer and regulator expert Eric Kayla. Kayla will discuss how to properly select and size a pressure reducing regulator and cover:
- Understanding pressure reducing regulator flow curves
- How to use a flow curve to size a pressure reducing regulator
- How to size a pressure reducing regulator for different types of media
Here's a sample of what will be covered:
Manufacturers usually create gas flow curves using air or nitrogen. If the system media is a different fluid, it may be necessary to adjust the flow scale to account for the difference between the specific gravity of the actual system fluid (G actual) and that of the fluid used to create the curve (G ref). The effect of specific gravity changes the flow rate by a factor (FG):
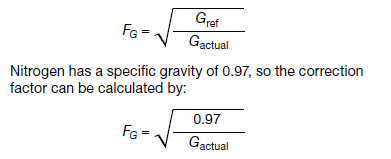
where G actual is the specific gravity of your system fluid. For convenience, below is a list of specific gravity correction factors calculated with this equation to adjust a flow scale from nitrogen to several other gases.
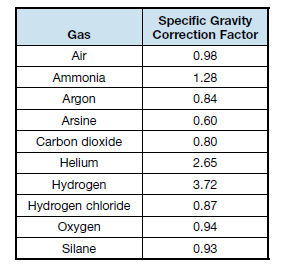
For example, the correction factor for carbon dioxide is 0.80. Therefore, the point on a flow curve showing a nitrogen flow volume of 100 std ft3/min (2831 std L/min) indicates a comparable carbon dioxide flow of 80 std ft3/min (2265 std L/min). The curve is the same, but the flow scale
changes.
In a hurry or have a question? Please call our office at 510-933-6200.
Added bonus: Book a phone consultation with the presenter
Call in to book a phone consultation with Eric Kayla for Thursday, January 17th. He will be available Thursday afternoon to consult with you on your pressure regulator application. Call 510-933-6200 to make a phone appointment.
Additional resources:
Related articles:
Webinar Replay: The Theory and Operation of Pressure Reducing Regulators
Related downloads:
Technical Bulletin and Article on Pressure Regulator Flow Curves
Slide Deck: The Theory and Operation of Pressure Reducing Regulators
Q&A from The Theory and Operation of Pressure Reducing Regulators
Swagelok Pressure Regulators Catalog